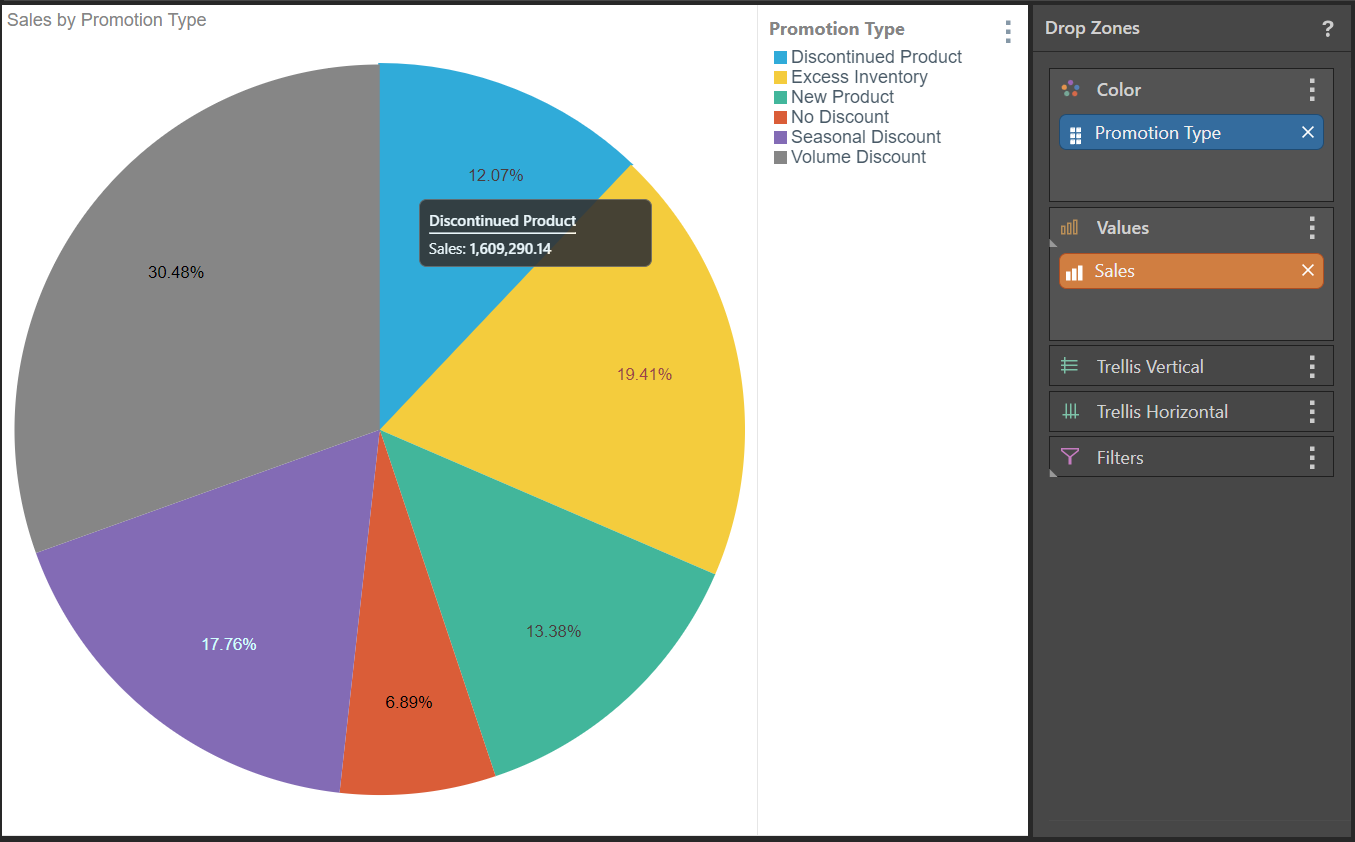
Segment charts provide good ways to visualize a few elements as a proportion of a total. Segment charts require a member hierarchy in the Color drop zone and a measure in the Values zone. The member hierarchy drives the segment colors, with each member element being represented by a segment; the value drives the size of the segments.
There are four segment charts to choose from: